In this section you will find a description of all those reports that are helpful to the hotel managers' daily operations. You will find important information about current or forecasted occupancy level, guests, channel production and much more!
Lodging Statistics Report
The Lodging Statistics Report gives you important information about occupancy and revenue. The information is displayed both in a percentage and a numeric value, and it can be used to calculate past, present occupancy, but also to forecast it. Data about revenue is also broken down by room/additional charges and taxes. The report also offers an average daily rate by date.
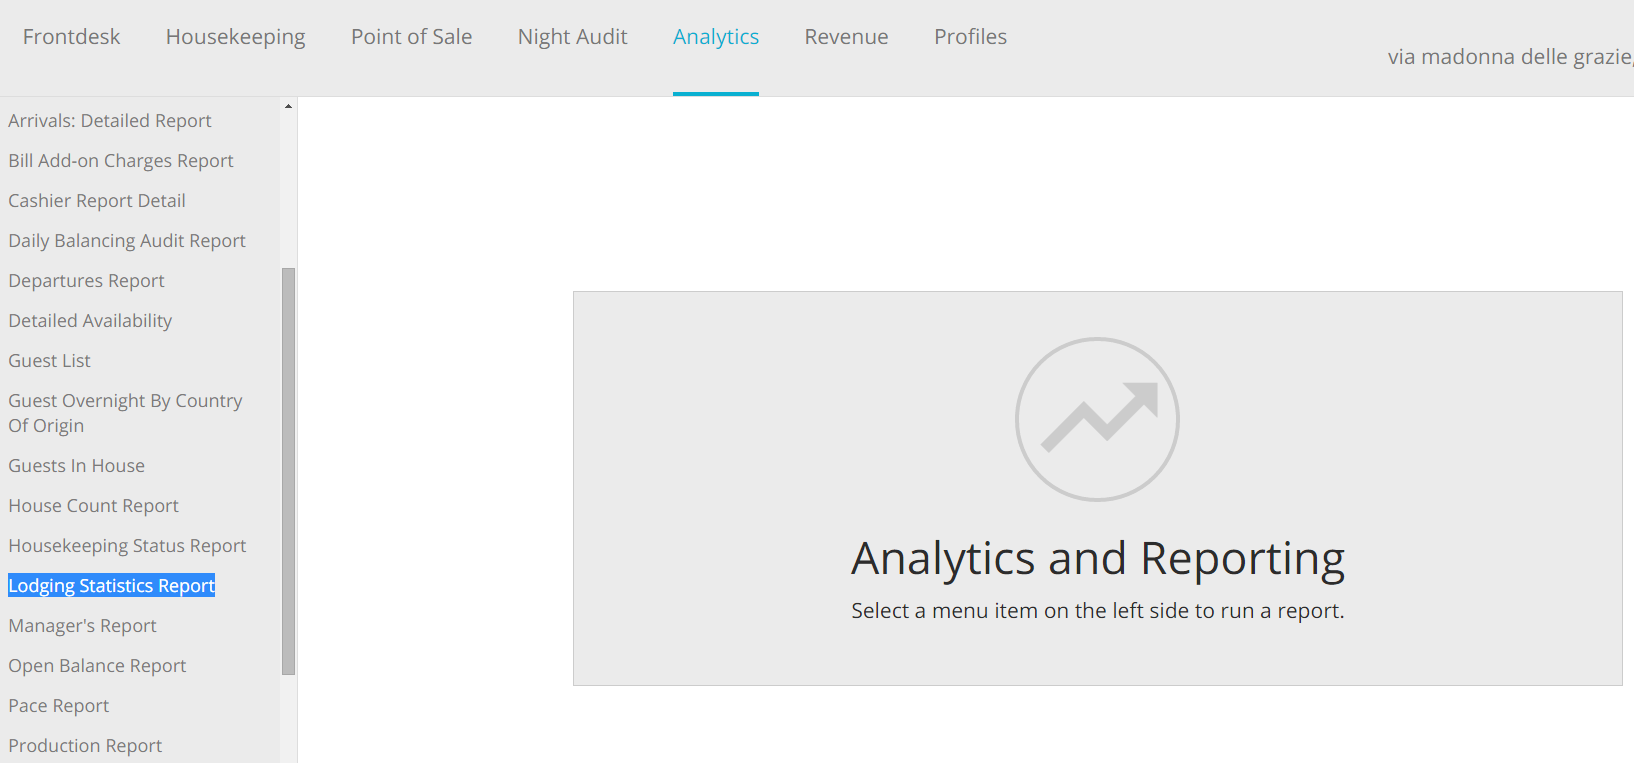
- In the reports list, click on the link Lodging Statistics Report:
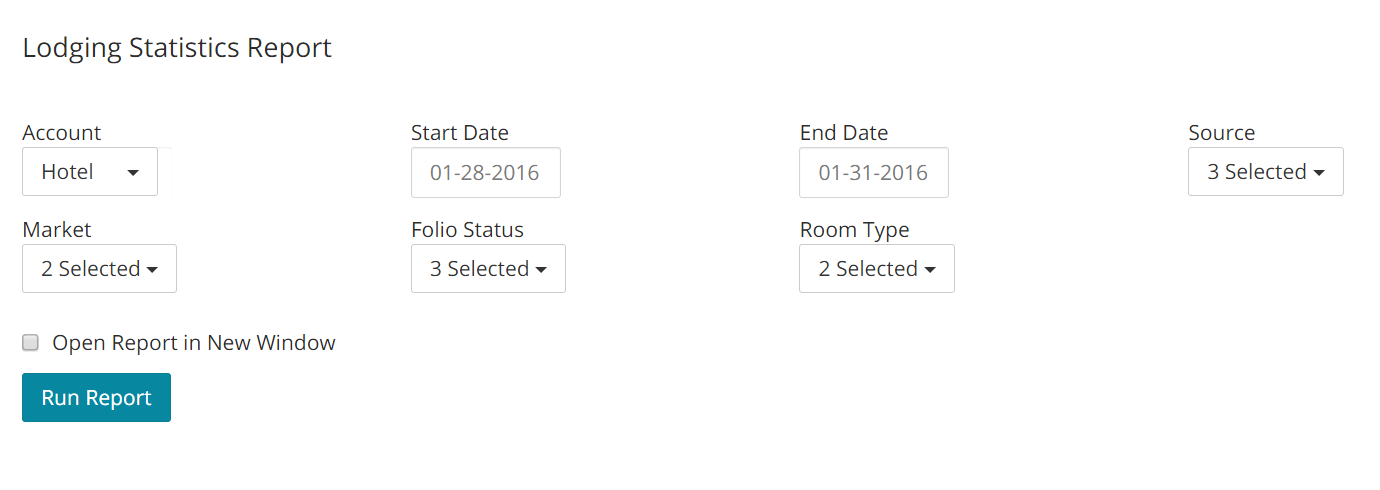
- Select your filters: you can run the report by room types and by sources and market. When done, click ont he button Run Report:
- Here is an example of this report:
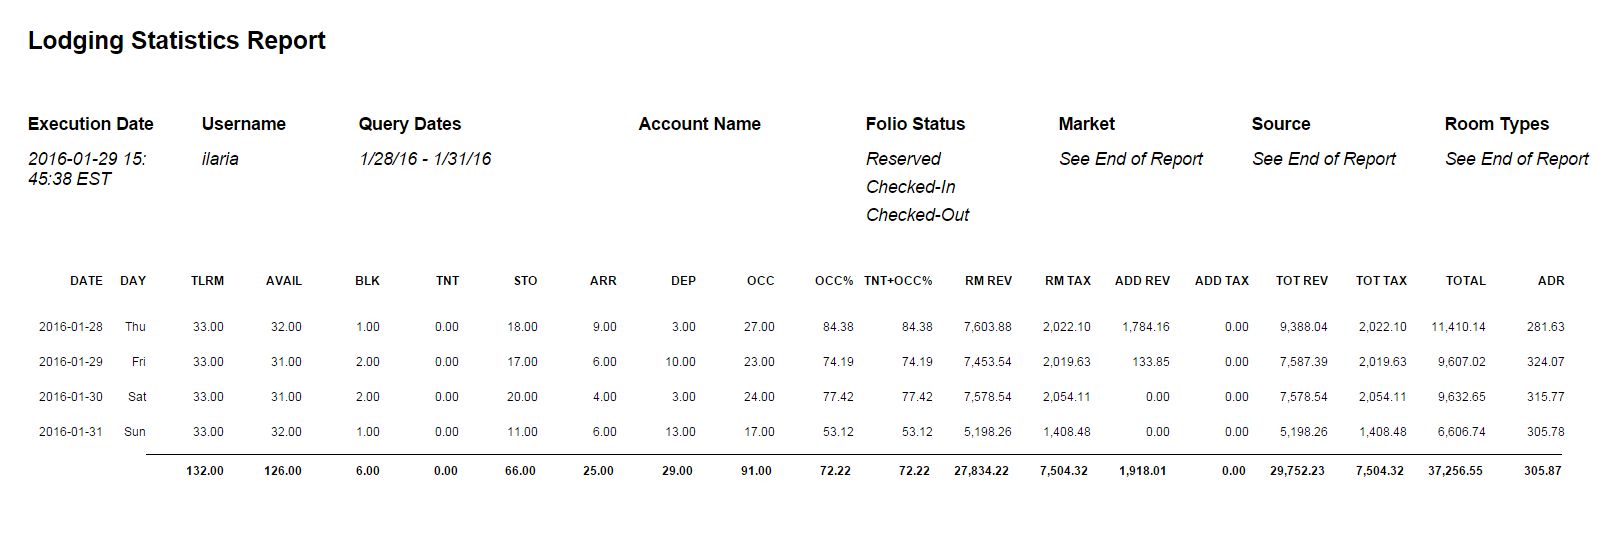
Fields legend
Date: date for which information is shown.
Day: day of the week for the date shown.
TLRM: total number of rooms at the property for the date shown.
AVAIL: number of rooms available.
BLK: number of rooms blocked.
TNT: Tentative Occupancy. It shows the number of rooms in a Hold status.
STO: number of Stay Overs.
ARR: number of arrivals.
DEP: number of departures.
OCC: occupancy value.
OCC %: percentage of occupancy.
TNT + OCC%: percentage of tentative and real occupancy.
RM REV: room revenue.
RM TAX: total tax applied to room revenue.
ADD REV: additonal revenue.
ADD TAX: value of tax applied to additional revenue.
TOT REV: sum of Room Revenue and Additional Revenue.
TOT TAX: sum of Room Tax and Additonal Revenue Tax.
TOTAL: sum of Total Revenue and Total Taxes.
ADR: Average Daily Rate.
Manager’s Report
The Manager’s Report gives managers a quick overview on daily, month-to-date and year-to-date occupancy and revenue values. It includes forecasting information for the upcoming year and the next 365 days, offering a great understanding on how the business is/will be doing.
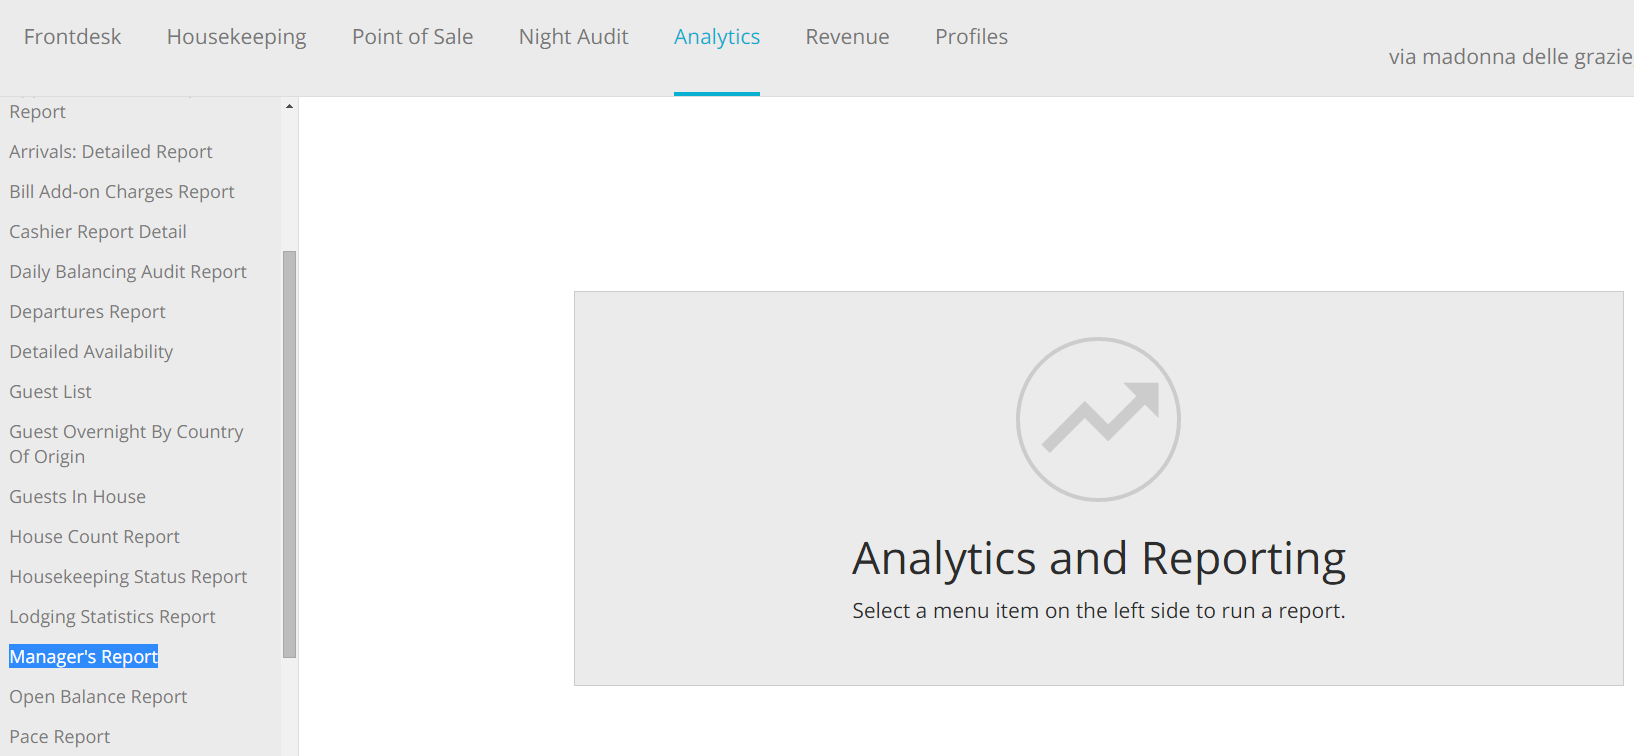
- In the reports list, click on the link Manager’s Report:
- Select your filters and click on the blue button Run Report:
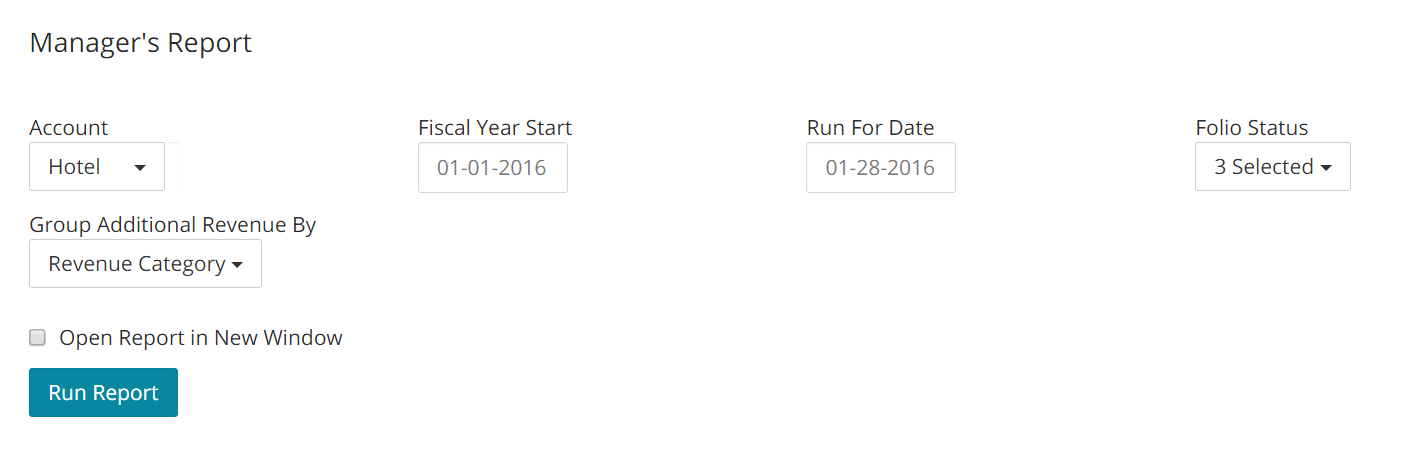
- Here is an example of this report:
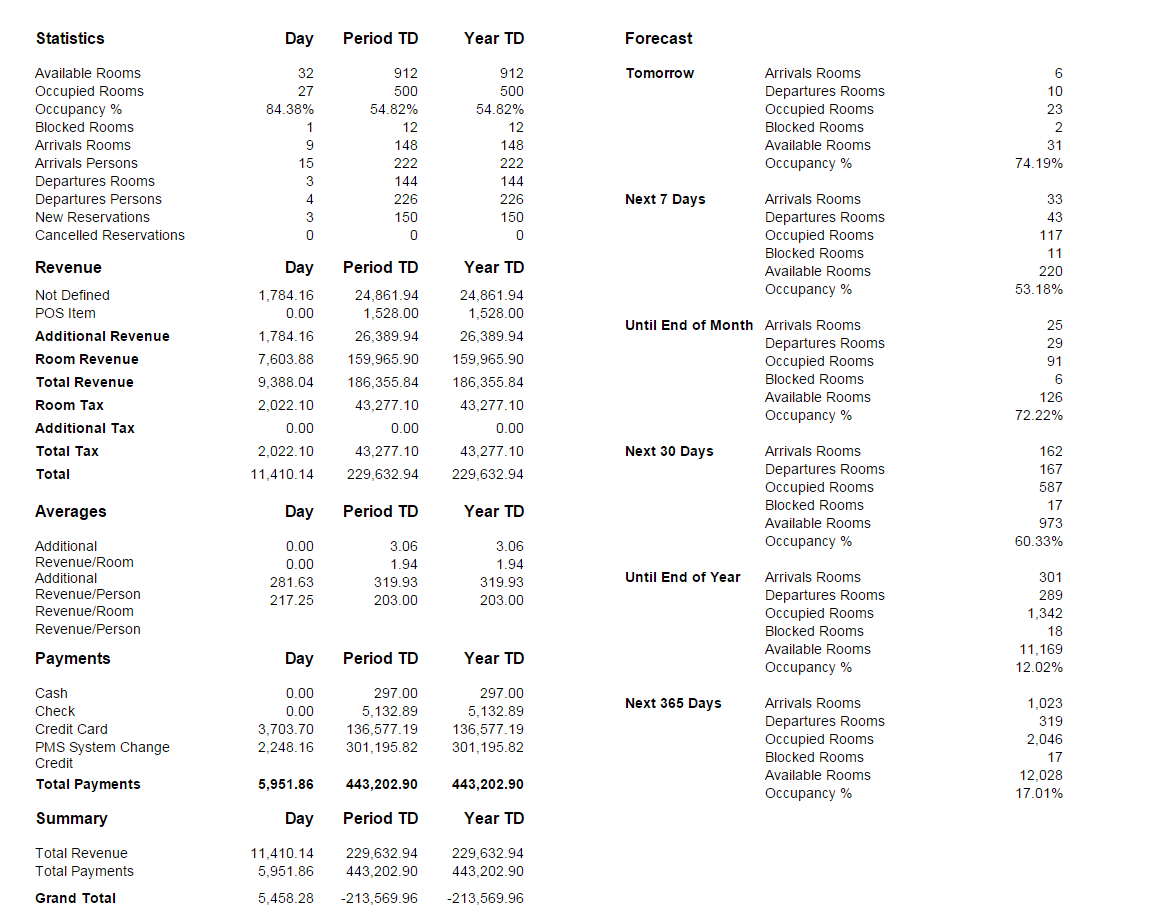
Fields legend
Day: shows information for the current day.
Period TD: period to date.
Year TD: year to date.
Pace Report
The Pace Report compares information from two different date ranges of your choice, it shows information about reservations on the books and tracks booking trends in order to maxime revenue!
- In the reports list, click on the link Pace Report:
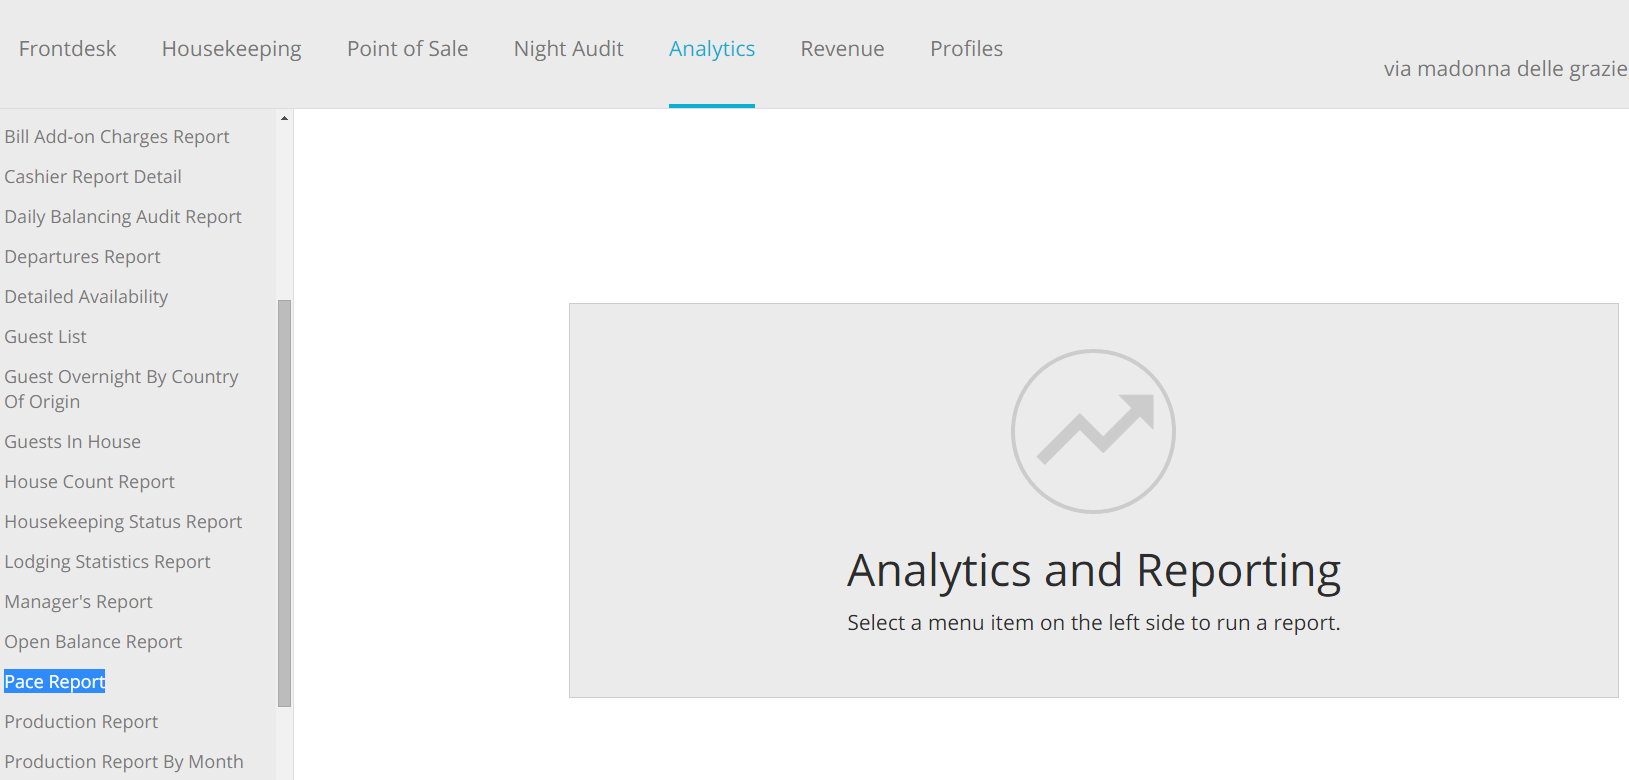
- Select youe filters and the date ranges you want to compare and click on the blue button Run Report:
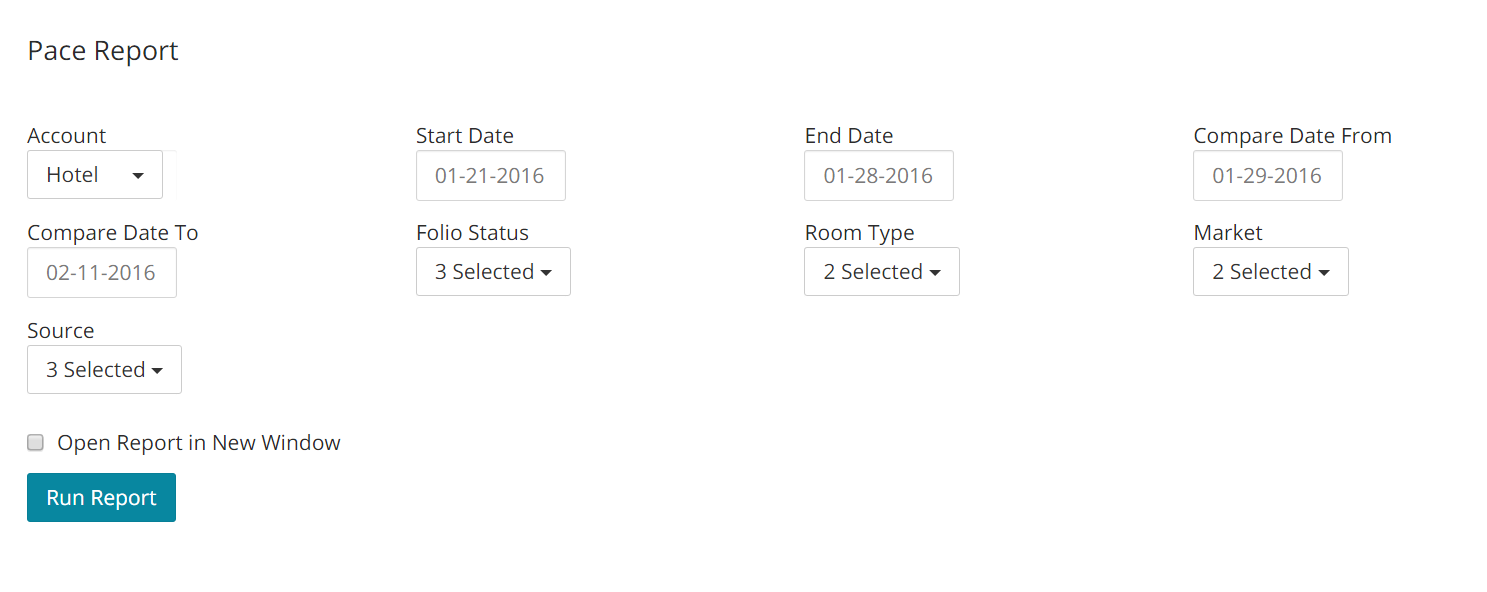
- Here is an example of this report:
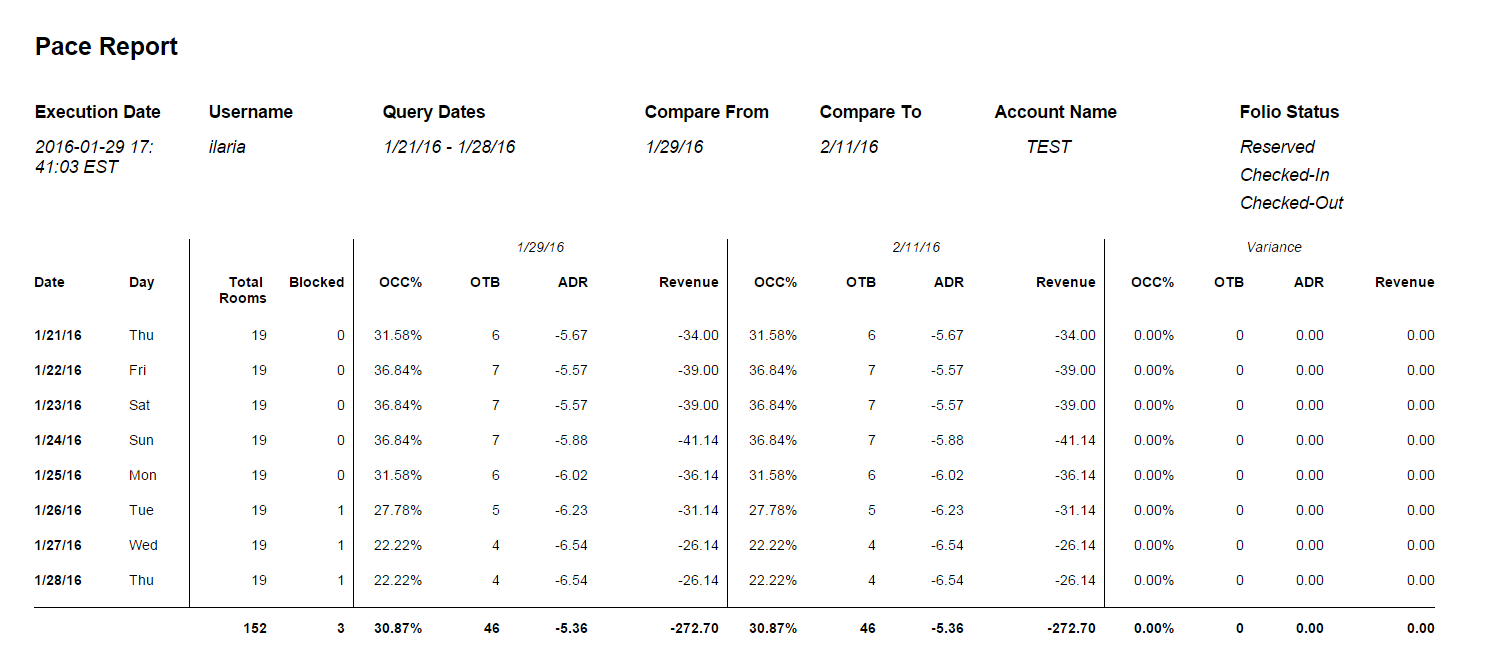
Fields legend
Date: breakdown by day of the period selected as date range.
Day: corresponsindg day of the week.
Total Rooms: total rooms at the property.
Blocked: bblocked rooms at the property for the selected date range.
OCC%: occupancy percentage.
OTB: reservation On The Book.
ADR: Average Daily Rate.
Revenue: total revenue.
Production Report By Month
The Production Report By Month gives you a monthly summary of four different information types: bookings, occupancy, PAX and Unique Guests. You can also have the result organized by Source or Market. A line chart of the information is also supplied as a visual aid to help the user see how Source/Market information changes on a monthly basis.
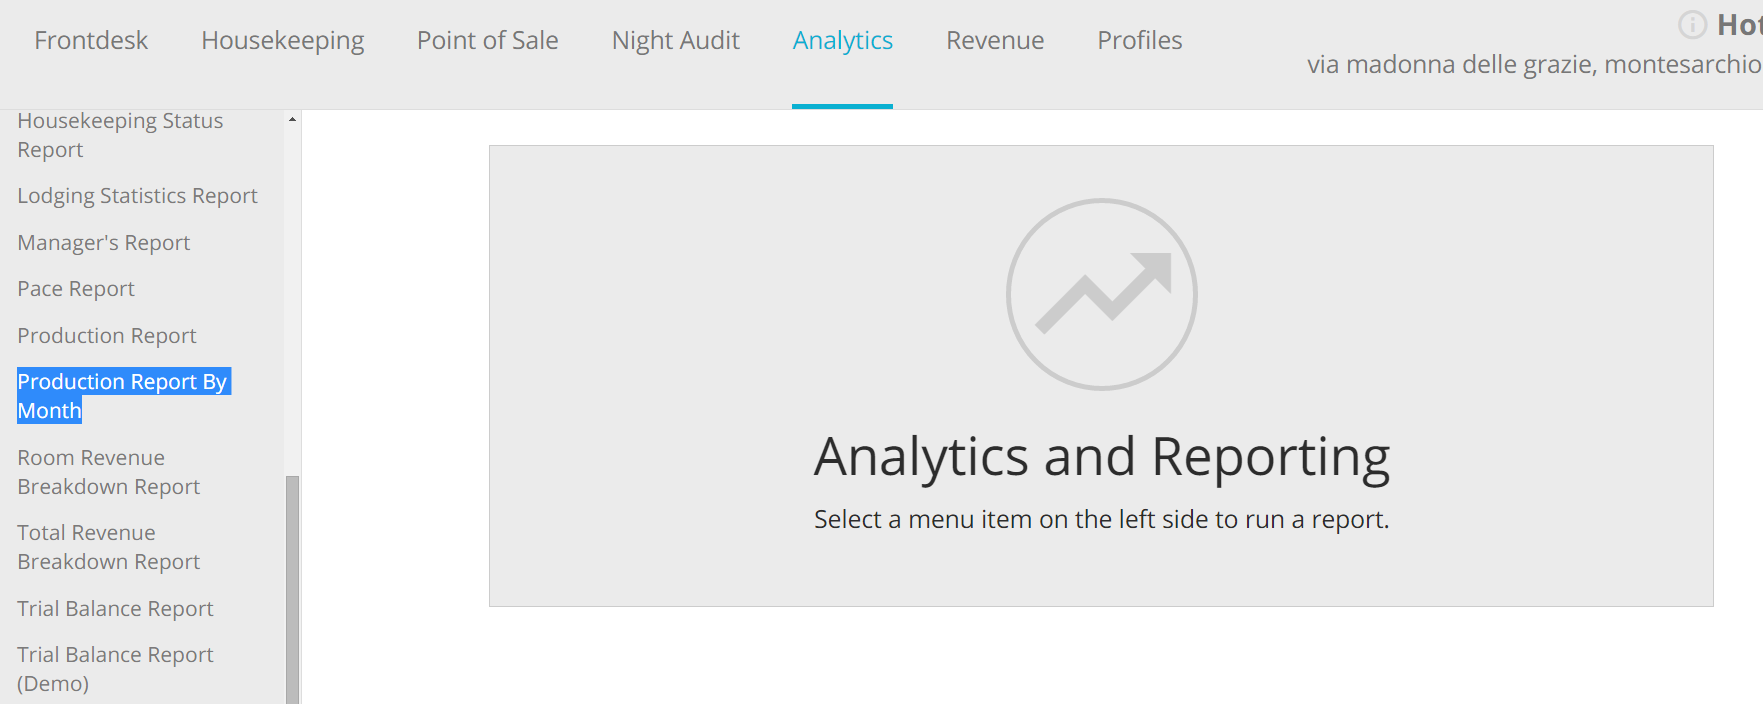
-In the reports list, click on the link Production Report By Month:
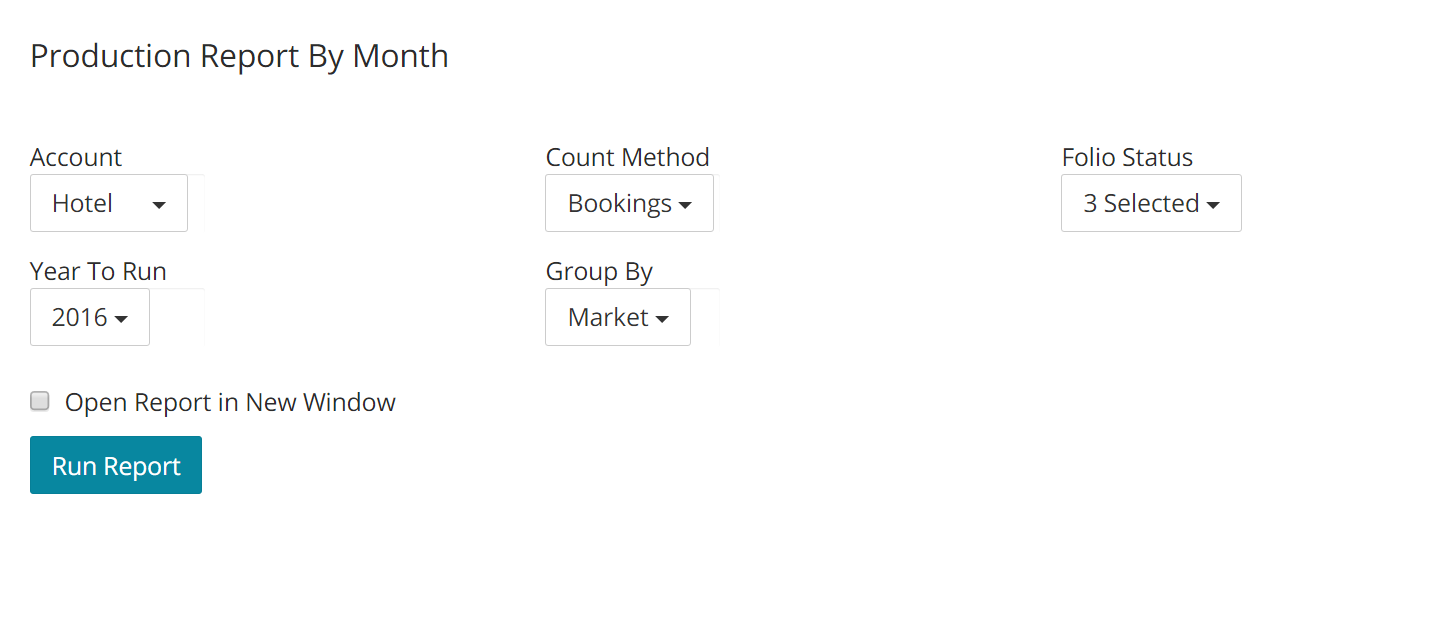
- Choose your filters. You can decide if running the report by:
1.Bookings: number of reservation folios.
2.Occupancy: room nights.
3.Unique Guests: number of guests per folio.
- PAX: number of guests per night.
When finsihed, click on the blue button Run Report:
- Here is an example of this report:
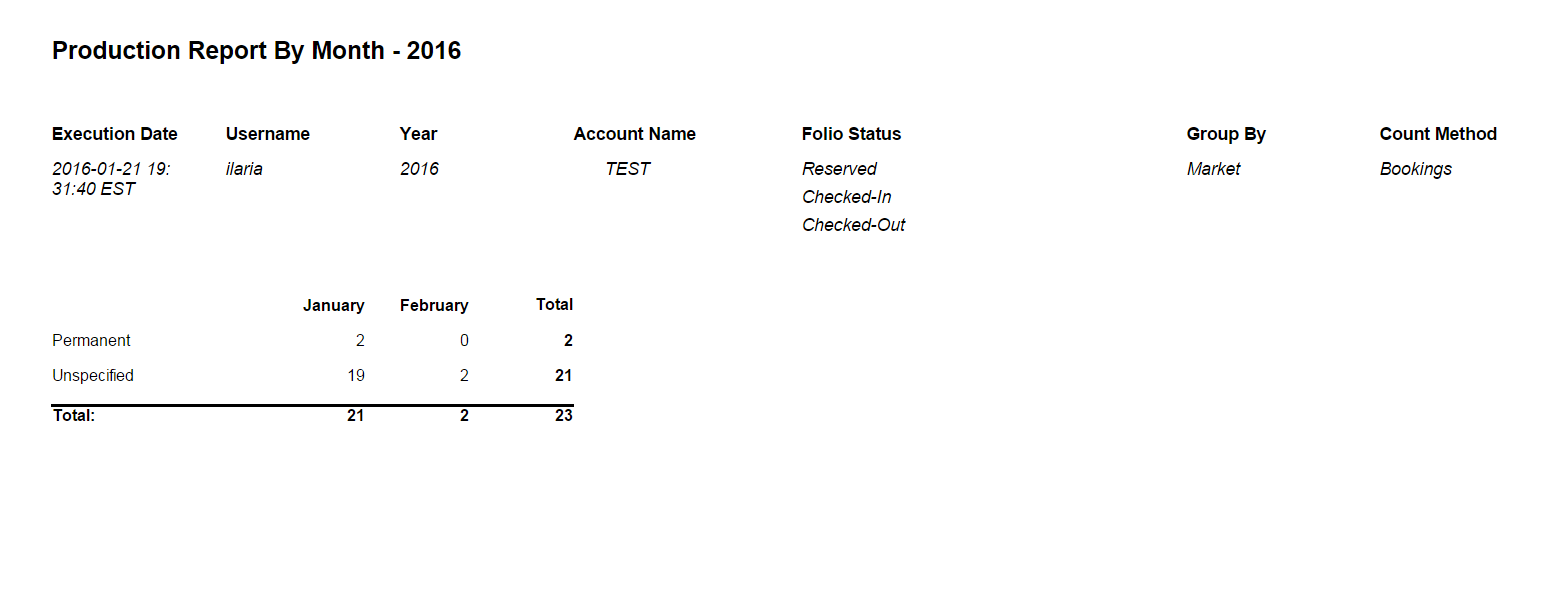
Fields legend
Market/Source: lists all market/source names associated with the number of reservation shown.
Month: shows the number of reservation per month. Note that the report will display only months with existing reservation loaded.
Total: sum of all reservation for all displayed months.
Tags: